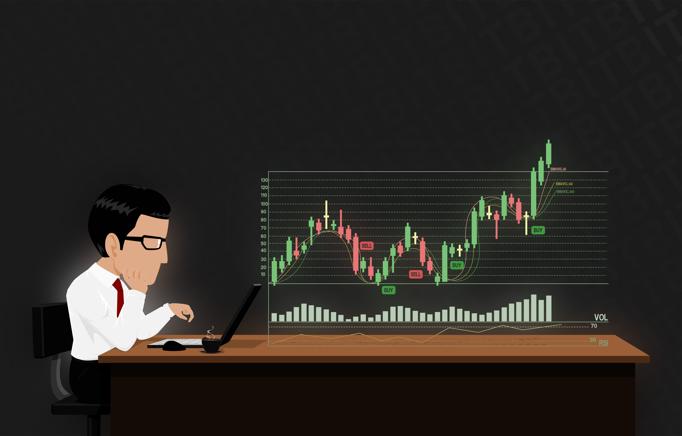
What is technical analysis
Crypto for Beginners
Other articles
It's commonly used to generate short-term trading signals from various charting tools, but it may also aid with assessing a security's strength or weakness in relation to the larger market or one of its sectors. This data aids analysts in bettering their overall valuation estimate. In the late 1800s, Charles Dow and the Dow Theory established technical analysis as we know it today. Nowadays, technical analysis includes hundreds of patterns and signals that have been established over many years of research.
As mentioned above, there are some types of analysis which are used the most, so we will only take a closer look at those.
Moving Average
Moving averages are a popular and simple lagging indicator that smooths out price volatility and provides a clearer view of a digital asset's average price over a given time period. Moving averages are divided into two categories:
- Moving averages (simple)
- Exponential moving averages (EMAs)
Simple moving averages employ the arithmetic mean of a group of values, whereas exponential moving averages give more weight to current price activity. Moving averages can be used independently or in combination. EMA is the most useful in a trending market because it clearly signalises the way market is moving.
Support and Resistance Level
Identifying areas of support and resistance — where a digital asset's price is predicted to stop declining or stop climbing, respectively — is one of the most straightforward and successful approaches of conducting technical analysis. Because the cryptocurrency market is merely a marketplace for buyers and sellers, demand for a digital asset should rise as its price falls, and vice versa – at least in theory. Simply put, the market frequently has an interest in buying or selling at a specific price, resulting in difficult-to-break-through levels.
Bollinger Bands
Bollinger Bands is a common technical analysis approach that involves drawing three lines, one below and one above the asset price line. To build an envelope, its precise period moving average is labelled as midline. These lines depict a volatility band or range in which a security's price is moving up or down. Because standard deviation is a measure of volatility, volatility is shown based on standard deviation for a particular security, which is denoted by upper and lower line/band. John Bollinger coined the term "Bollinger Bands" in the mid-1980s, and he trademarked it in 2011. It was originally known as trading bands, but John Bollinger refined the concept and dubbed it Bollinger Bands.